

Note: This Chapter, images and video were created by little tools that I wrote to generate a textbook chapter and little video from lecture notes.
FOR DETAILS ON LIVING MODELS:

On a Tuesday morning in the third quarter, a senior data team at a major digital platform gathered around a conference room screen to review the weekly metrics. The dashboard showed exactly what everyone had hoped to see: a clean, upward-sloping line, Weekly Active Users climbing from 2.1 million to 2.5 million — an 18 percent increase that the visualization rendered in a satisfying shade of green. Leadership left the meeting energized. Growth strategies were reaffirmed. A hiring plan was accelerated. The chart was screenshot and dropped into an investor deck.
None of it was real.
A junior analyst, running a routine data quality check four days later, discovered that the European user dimension table had experienced a partial refresh failure the previous Thursday. Approximately 400,000 user profile records had quietly vanished from the reporting pipeline. The 400,000 users did not appear as absent — they did not generate an error message or a null value or a red flag on the visualization. They simply ceased to exist, as far as the reporting system was concerned. The denominator shrank. The ratio climbed. The dashboard had not lied in the way a fraudster lies. It had lied the way a measuring instrument lies when its reference point drifts: precisely, consistently, and in a direction that felt like good news.

The team’s immediate instinct, once the failure was identified, was to classify it as a technical problem: a data pipeline issue with a data pipeline fix. And they were right, as far as they went. The fix was implemented. The alert was added. The architecture was made more robust. But the senior analyst who led the investigation noticed something that troubled her more than the pipeline failure itself. In the four days between the bad Thursday and the good Wednesday, no one had asked whether the data was reliable. The number had looked right, so it had been treated as right. The dashboard’s authority had been borrowed from its appearance of precision, not from any demonstrated correspondence to the world it claimed to describe.
This is not a story about a database query. It is a story about what an organization believed it was entitled to know — and how that belief, left unexamined, became the mechanism of its own deception.
The Question That Changes Everything
In 2012, J.C. Penney’s incoming CEO Ron Johnson faced a different problem with the same underlying structure. Where the digital platform team had trusted a number that was technically false, Johnson trusted a number that was technically true — and drew from it an inference the data was structurally incapable of supporting.

The observation was real: J.C. Penney’s promotional pricing events were correlated with revenue spikes, followed by sluggish baseline sales between events. The inference Johnson drew was that the promotions were suppressing customers’ willingness to pay at full price — that eliminating them would lift the baseline and simplify the customer experience. Within eighteen months, the company had lost $4.3 billion in annual revenue, and Johnson had been fired.
The number was correct. The inference was wrong. These are not the same failure, and understanding the difference between them is the reason this book exists.
Johnson had observed what statisticians call a conditional distribution: the pattern of revenue given that promotional events were present in the historical record. He used it to predict what would happen if he eliminated those events by decision. The first is an observation. The second is the result of an intervention. The gap between them is not a matter of analytical sophistication or sample size or model refinement. It is a categorical distinction at the foundation of causal reasoning — and it is a gap that no amount of additional historical data can close.
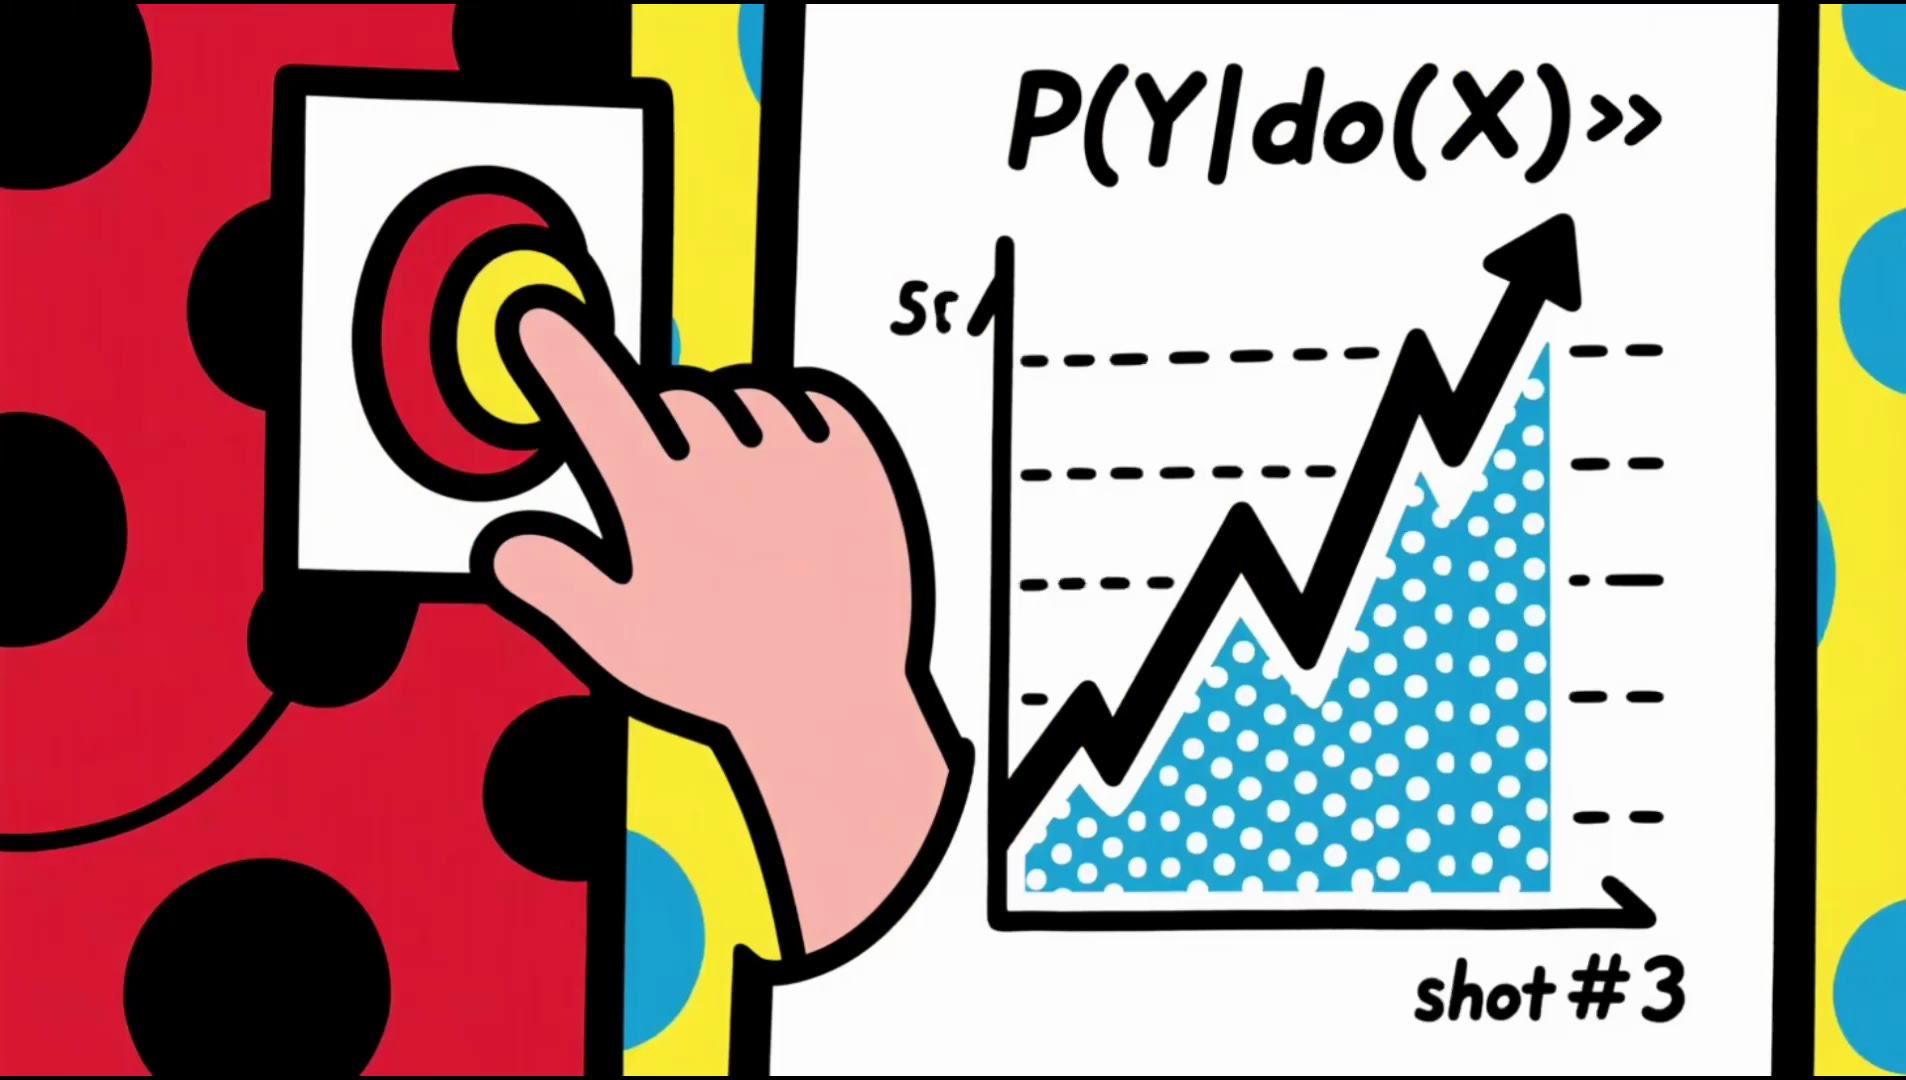
The distinction has a precise mathematical form. P(Y | X) is a conditional probability: the probability of outcome Y given that we observe condition X in the data. It describes what tends to co-occur in the historical record. P(Y | do(X)) is an interventional probability, and the do(·) operator — introduced by the mathematician and computer scientist Judea Pearl — is doing precise conceptual work. The do operator represents deliberate manipulation: not observing that X is present in the world, but actively setting X to a value by action. When Johnson eliminated promotions, he was not observing a world in which promotions happened to be absent. He was making them absent. That is a do. And the historical data, which recorded only worlds in which J.C. Penney had always run promotions, had nothing to say about what a do would produce.
What the historical data could not reveal — what it structurally could not reveal — was that J.C. Penney’s customers did not experience promotional pricing as a distortion of their true preference. For a significant portion of the customer base, the promotional event was the experience. The hunt for the deal, the satisfaction of the markdown, the social performance of having paid less than full price: these were not friction in the system. They were the system. Eliminating the promotions did not reveal latent demand for everyday low prices. It destroyed the mechanism through which customers had been choosing to shop at all. The causal structure of customer behavior was simply not visible in the observational record. And because Johnson’s analytical framework had no language for the distinction between observing a world and making a world, he could not have known what he was missing.
This is the central epistemological divide that this book is built to cross. Every business decision of consequence is, at its core, a do question: not “what tends to happen when X is present in the data?” but “what would happen if we made X happen?” Descriptive and correlational methods can answer the first question. The architecture this book calls a Living Model is built to answer the second.
Pearl’s Ladder and the Structure of Causal Reasoning
The P(Y | X) versus P(Y | do(X)) distinction is not an isolated concept. It is the first step on a three-rung hierarchy that Judea Pearl calls the Ladder of Causation — a framework that describes three qualitatively different classes of question, each requiring more powerful analytical machinery than the last, and none of which can be reached by accumulating more data at the rung below
The first rung is association: what does the data show? Questions at this level take the form “what tends to happen when X is observed?” They are answerable by correlation, regression, and the full toolkit of descriptive statistics. Every dashboard ever built operates at this level. The WAU dashboard was a Rung One instrument. So was J.C. Penney’s pricing analysis. So is every A/B test result that reports lift without accounting for the causal structure it assumes. Association is indispensable. It is also, alone, insufficient.
The second rung is intervention: what would happen if we acted? These questions require the do-operator and the causal inference methods that give it operational meaning — directed graphs, structural equations, the identification criteria that tell us when an interventional effect can be estimated from observational data and when it cannot. This is the level at which Johnson’s decision should have been analyzed. It is the level at which most consequential organizational decisions live, and the level at which most organizational analytics cannot operate.
The third rung is counterfactual: what would have happened if things had been different? Counterfactuals require not just a causal model but a structural causal model — a mathematical object that encodes the mechanisms of the world with enough precision to reason about individual-level outcomes in worlds that never existed. “Would J.C. Penney have retained customers if it had phased out promotions more gradually?” is a counterfactual. “Would this patient have survived if we had given the other treatment?” is a counterfactual. These are the hardest and most valuable questions in decision analytics.
The hierarchy has one property that makes it unlike a progression of technical skills: no rung is reachable by accumulating more data, more compute, or more analytical sophistication at the rung below. This bears repeating because it runs against the grain of how most data organizations have been built. A team with a thousand-row dataset and a structural causal model can answer questions that a team with a billion-row dataset and a correlation engine cannot. The Ladder describes not a gradient of difficulty but a series of categorical shifts in what kind of question is even being asked. J.C. Penney did not need more historical transaction data. It needed a different kind of instrument.
This book is a sustained ascent of that Ladder. The current chapter locates the problem at the first rung: it documents what association-level analytics can do, what it cannot do, and what organizational damage results from conflating the two. The chapters in Part One map the broader failure modes of analytics that never leaves the first rung. Part Two builds the mathematical foundations of the second and third rungs. Part Three describes the Living Model — the analytical architecture that this book is building toward, designed from the ground up to operate at the interventional and counterfactual levels, continuously updated as new data arrives, oriented toward decisions rather than descriptions. The Ladder is the book’s spine. You will encounter it again.
The Anatomy of a Silent Failure
Both the WAU dashboard and J.C. Penney’s pricing decision share a structural feature worth naming precisely: the failure was invisible at the surface level. The visualization worked. The SQL was valid. The transaction data was real. In neither case did any component of the analytical system announce that something had gone wrong. The failure was not in any single instrument; it was in what each instrument was incapable of seeing about itself.

This defines what might be called the silent failure mode of first-rung analytics. A system that crashes announces itself. A system that quietly changes what it measures — or that was never measuring what its users believed it was measuring — does not. The WAU dashboard’s silence was mechanical: the missing records generated no error state because the pipeline’s architecture treated absence as the absence of absence. J.C. Penney’s analytical silence was epistemic: no component of the inference chain was wrong, and yet the inference itself was catastrophically in error, because the framework contained no mechanism for distinguishing observation from intervention.
The organizational cost of silent failures extends beyond the immediate decision. The WAU audit could establish what had gone wrong in the current reporting cycle, but it could not retroactively certify the integrity of the historical record. No one could answer the question of how many prior decisions had been made on data that was silently incomplete. J.C. Penney’s postmortem could reconstruct the inferential error, but it could not recover $4.3 billion or the institutional trust of a customer base that had been told, by a year of pricing policy, that their relationship with the brand was being renegotiated without their consent. Trust broken by a silent failure does not snap cleanly back — not because the failure was malicious, but because it was invisible for so long that the recovery itself becomes evidence that the visibility problem persists.
The corrective posture — for both the technical and the epistemic versions of the same failure — is what the field of data engineering calls observability: not a monitoring system bolted onto an analytics stack, but a measurement architecture that treats its own integrity as a first-class output. An observable analytics system does not just tell you what is happening to your users. It tells you what is happening to itself. An observable causal inference framework does not just tell you what the data shows. It tells you which questions the data is structurally capable of answering, and which it is not.
This is the orientation this book attempts to install. The remainder of Part One documents the failure modes in detail. Part Two builds the mathematical apparatus that makes the distinction between association and intervention computable rather than merely philosophical. Part Three shows how to build a system that carries that distinction forward into organizational decision-making, continuously, as a structural property rather than an occasional analytical exercise.
The Four Rungs of Organizational Analytics Maturity
The theoretical Ladder of Causation has a practical counterpart in the analytics capabilities of organizations. Most enterprises move through four recognizable stages of analytical maturity, and understanding where an organization currently sits is the prerequisite for understanding what its data can and cannot tell it.
The foundational stage is descriptive analytics, which answers the question: what happened? The tools are dashboards, aggregation queries, and visualization platforms. The mindset is archival. An organization at this stage may have beautiful, interactive, real-time visualizations — and yet it is looking backward, at association-level data. The specific vulnerability of this stage is that it has no mechanism for distinguishing between a true signal and an artifact of its own measurement process. A dashboard cannot ask whether its own output is reliable. It can only display what the pipeline returns.
The diagnostic stage adds the question: why did it happen? This requires moving from correlation to causal mapping — tracing the structural drivers of observed patterns rather than simply documenting the patterns themselves. A diagnostic analyst looking at a margin squeeze does not just record that margins fell in Q3. She asks whether the compression came from procurement price increases, a shift in product mix, labor cost inflation, or pricing decisions made in response to competitive pressure. Each of these explanations implies a different intervention. Treating them as interchangeable is the descriptive stage error applied to management decisions. Diagnostic maturity requires that data not sit in silos — when the cost data, the pricing data, the headcount data, and the procurement data live in separate systems with no shared ontology, the causal mapping that this stage requires is simply not possible. Organizations fail here not because they lack analytical talent but because their data architecture was built for record-keeping, and no one has built the bridges.
The predictive stage asks: what will happen? This is where machine learning, time-series modeling, and statistical forecasting live. It is also where the relationship between models and the world becomes most consequential and most fragile. A predictive model is an assumption that the statistical relationships present in historical data will persist into the future. When that assumption holds, predictive models are extraordinarily powerful. When the world changes — when a pandemic restructures consumer behavior, when a competitor’s collapse redistributes market share overnight — models trained on the old world continue to predict the old world’s future. They are not aware of their own staleness. This phenomenon, known as concept drift, is the predictive stage’s version of the silent failure: the model continues to produce outputs; those outputs no longer reflect reality; the model does not announce the change.
The prescriptive stage asks: what should we do? At this level, analytics is integrated directly into operational decision-making. A prescriptive procurement system does not generate a vendor risk score for a human to review next week — it monitors vendor performance in real time, evaluates risk against a continuously updated threshold, and triggers a specific downstream action within a defined response window. But prescriptive analytics carries a specific and underappreciated danger: speed without a governor. On August 1, 2012, Knight Capital Group deployed an automated trading system that executed in error at algorithmic speed. In 45 minutes, the firm lost $440 million because no human decision node existed between the system’s execution loop and the market. The system was working exactly as designed. The design had no provision for stopping.
The governance lesson is structural, not attitudinal. A prescriptive system can pause a purchase order automatically, but only a human can permanently terminate a supplier relationship. It can flag an anomaly and suppress a transaction, but only a human can authorize the broader strategic response. The boundary between what the system decides and what the human decides must be explicit, documented, and enforced — not as a bureaucratic checkpoint, but as the architectural feature that distinguishes a decision-support system from an autonomous agent with no accountability surface.
Critically, even a fully realized prescriptive system falls short of what consequential decisions actually require if its recommendations are derived from observed correlations rather than estimated causal effects. A prescriptive engine that recommends the highest-ranked action from a historical association model will fail in deployment for the same reason J.C. Penney’s pricing strategy failed: it is measuring what tends to co-occur, not what would happen under deliberate intervention. The organizational maturity ladder and Pearl’s Ladder are parallel climbs. An organization can reach the prescriptive stage and still be operating entirely on the first rung of causation. Recognizing that possibility is the beginning of building something better.
Why Most Enterprises Stay at the First Stage
The distribution of organizations across these four stages is not primarily a function of technical capability or budget. Advanced modeling tools are widely available. Data engineering talent, while expensive, can be hired. The barriers that keep most enterprises at the descriptive stage are organizational and cultural, and they are more difficult to dismantle than any technical debt.
The first barrier is incentive structure. Descriptive analytics produces reports. Reports are legible, shareable, and defensible. A dashboard screenshot can accompany an executive presentation without requiring anyone to commit to an interpretation. A diagnostic finding — the margin compression is driven by a pricing decision made in response to a competitor move, not by raw material cost inflation, which means the standard cost-reduction response will fail — is harder to communicate and harder to act on. It implicates decisions made by specific people. It requires those people to change course. The descriptive stage is politically convenient in a way that causal analysis is not, and organizational incentive structures tend to reward the politically convenient.
The second barrier is data architecture. Organizations accumulate data systems the way cities accumulate infrastructure: opportunistically, incrementally, without overall design. An ERP system purchased in 2009, a CRM platform added in 2014, a marketing automation tool licensed in 2018 — each was selected to solve a specific operational problem and stores its data in a format optimized for its own purposes. The causal maps that diagnostic work requires, the feature stores that predictive modeling requires, the automated decision pipelines that prescriptive work requires: all of these demand a unified data model that most organizations have never built because they were never designed for integrated analytics.
The third barrier is the comfort of the lagging indicator. A dashboard showing last week’s revenue, last month’s churn rate, last quarter’s customer acquisition cost is a record of what has already happened. It cannot be wrong in the way a forecast can be wrong. It does not require anyone to commit to a prediction and be held accountable if that prediction fails. For organizations whose reporting culture is built around the safety of the historical record, the move toward predictive and prescriptive analytics represents an acceptance of the risk of being visibly, attributably wrong — a fundamentally different relationship with uncertainty than the backward-looking dashboard affords.
These three barriers interact. An organization that lacks diagnostic capability cannot validate the features its predictive models require. An organization that cannot predict cannot optimize. An organization whose leadership is rewarded for reporting last quarter’s results has no structural incentive to invest in the capabilities that would allow it to influence next quarter’s. The four stages are not just a technical progression — they describe a theory of organizational epistemology: what an enterprise believes it is entitled to know, and how much risk it is willing to accept in the pursuit of knowing it.
Living Models: The Destination
The analytics maturity stages describe the organizational capability required to move from description to prescription. But even a fully realized prescriptive system, as defined above, falls short of what consequential decisions actually require. A prescriptive system that derives its recommendations from observed correlations rather than estimated causal effects will recommend interventions that look effective in historical data and fail in deployment — for the same reason that J.C. Penney’s pricing strategy looked defensible in the cross-sectional data and catastrophic in execution. The system was measuring association. The decision required intervention.
A Living Model is the analytical architecture this book is building toward. The term has a precise meaning.
A Living Model is causal: its structure encodes mechanisms, not correlations, and its recommendations are expressed as estimated interventional effects — P(Y | do(X)) — not as associations observed in the historical record. It is counterfactual: it can reason about what would have happened under conditions that did not occur, which means it can evaluate the cost of a decision not taken as rigorously as the benefit of a decision that was. It is continually updated: it maintains a live connection between new incoming data and the parameters of its causal model, so that the estimates it produces reflect current conditions rather than the statistical properties of a training set assembled at some prior date. And it is treatment-oriented: its output is not a description or a prediction but a ranked list of interventions, evaluated by their expected causal effect under the organization’s current constraints.
A dashboard is none of these things. A predictive model is the third of these things and none of the other three. A prescriptive system may approximate the fourth while still lacking the first two. A Living Model is not an upgrade to existing analytics infrastructure. It is a different kind of analytical object, built from different foundations, asking different questions. Those foundations are the subject of this book.
Return, briefly, to the conference room and the upward-sloping green line. The team that celebrated the 18 percent WAU increase did not make an unreasonable inference from the data they had. Given what the dashboard showed, growth was the sensible interpretation. The failure was not one of analytical incompetence. It was architectural: the team trusted that what the dashboard showed was what the data contained, and trusted that what the data contained was what the world held. Neither was verified.
Ron Johnson, working from J.C. Penney’s historical transaction data, made an inference that was equally defensible at the association level and catastrophically wrong at the interventional level. The difference between the two failures is one of scale — one cost four days of misdirected strategy, the other cost $4.3 billion in annual revenue and tens of thousands of jobs. But the mechanism is the same. In both cases, an organization used a tool designed to answer one class of question to answer a different class of question, and the gap between what the tool could see and what the decision required was invisible precisely because the tool’s output looked authoritative.
The remainder of this book is about closing that gap. Not by discarding descriptive analytics — it is foundational and irreplaceable — but by building, above it, the causal and counterfactual machinery that allows an organization to know, with rigor and specificity, what it can change and what it will get if it tries.
Student Activities
Problem 1.1 — The Measurement Integrity Audit. A retail analytics team reports that its primary dashboard showed a 12 percent increase in monthly active buyers over the previous quarter. Three months later, the team discovers that a supplier reclassification had quietly changed which customer accounts were included in the “active” definition partway through the measurement window. The reclassification was undocumented. Using the frameworks introduced in this chapter, (a) classify this failure by type — is it more analogous to the WAU dashboard failure or the J.C. Penney inferential failure, and why? (b) Describe the observability properties a measurement system would need to have detected this failure at the moment of occurrence rather than three months later. (c) Identify at least one prior organizational decision that might have been made on the basis of the distorted data, and describe the reversibility problem that would face the team attempting to audit that decision retroactively.
Problem 1.2 — The Loyalty Program Case. A retail analytics team reports a strong positive correlation (r = 0.72) between loyalty program membership and average order value. Leadership proposes expanding the loyalty program to all customer segments. Construct two plausible causal stories consistent with the observed correlation — one in which the program causes higher spending, and one in which the observed correlation reflects a pre-existing difference between customers who join and those who do not. For each story, identify the causal graph structure that would generate it and describe two specific pieces of data that would allow you to distinguish between them empirically. Express your answer using the P(Y | X) versus P(Y | do(X)) distinction. What does your analysis imply about the proposed budget decision?
Problem 1.3 — The J.C. Penney Forensic. Research the J.C. Penney pricing strategy collapse of 2012–2013. Identify the specific inferential error that the decision rested on, using the vocabulary introduced in this chapter. Then construct the counterfactual: under what conditions — what data, what analytical method, what organizational process — might the company have detected the error before implementation? What would a second-stage diagnostic analysis have required that first-stage descriptive analytics could not provide? Your answer should distinguish between what additional data would have helped and what different analytical framework was required — these are not the same thing.
Problem 1.4 — Stage Placement. Select an organization you are familiar with — a company, institution, or team. Based on the four-stage framework, diagnose where the organization currently sits. Identify the primary barrier (incentive structure, data architecture, or risk aversion) preventing it from advancing to the next stage. Propose one specific, implementable change — technical or organizational — that would address that barrier. Justify your recommendation with reference to the structural arguments in this chapter.
Problem 1.5 — The Observable System (Design Challenge). You are the analytics lead at a media streaming company. Your team’s primary dashboard tracks Daily Active Users, content consumption hours, and subscriber churn. Redesign the measurement architecture to be observable in the sense described in this chapter: it should detect and surface failures in its own measurement process before those failures reach decision-makers. Specify the monitoring logic you would implement, the alert thresholds you would set, and the “data integrity” panel you would add alongside the existing metrics view. Describe what a healthy state looks like, and describe three distinct failure signatures your architecture would catch. For each failure signature, identify the organizational decision it would protect.
Problem 1.6 — Open-Ended Design. The chapter argues that descriptive analytics is politically convenient in ways that causal analysis is not. Design an organizational incentive structure — including performance metrics, reporting cadences, and accountability mechanisms — that would create genuine institutional motivation to advance from the descriptive to the diagnostic stage. Your design should address the specific political barriers described in this chapter. Identify at least one unintended consequence your design might produce, and explain how you would mitigate it. As a check, evaluate your proposed structure against the four properties of a Living Model: which of those properties would your incentive structure make more or less achievable, and why?
Key Terms
Association. The first rung of Pearl’s Ladder of Causation. An association is a statistical relationship between two variables observable in data — a correlation, a conditional probability, a regression coefficient. Association answers the question what tends to co-occur? It does not answer what would happen under deliberate intervention.
Concept Drift. The gradual or abrupt invalidation of a predictive model’s learned relationships, caused by a shift in the underlying data-generating process. A model experiencing concept drift continues to produce outputs; those outputs no longer reflect reality. The model does not announce the drift.
Confounding Variable (Confounder). A variable that influences both the apparent cause and the apparent effect in an observed association, creating a spurious or distorted correlation between them. In the loyalty program example, pre-existing spending propensity drives both membership and order value, generating a positive correlation that does not reflect a causal mechanism.
Counterfactual. The third rung of Pearl’s Ladder. A counterfactual question asks: given that Y occurred under condition X, what would Y have been if X had been different? Counterfactual reasoning requires a structural causal model capable of reasoning about individual-level outcomes in worlds that did not occur.
Do-Operator (do(·)). A mathematical notation introduced by Judea Pearl to represent deliberate intervention: setting a variable to a specific value by action, as opposed to observing that it takes that value in data. P(Y | do(X = x)) is the probability of outcome Y if we intervene to set X to x — structurally different from P(Y | X = x), the probability of Y given that we observe X equal to x in the data.
Interventional Distribution. The probability distribution over outcomes that results from a deliberate do-intervention. Estimating the interventional distribution from observational data — without a randomized experiment — requires causal inference methods. The observational distribution and the interventional distribution will differ whenever unmeasured confounders, selection effects, or mediators are present in the causal structure.
Living Model. An analytical system with four defining properties: causal (structured around interventional effects, not correlations), counterfactual (capable of reasoning about outcomes in worlds that did not occur), continually updated (live connection between incoming data and model parameters), and treatment-oriented (output is a ranked list of interventions evaluated by expected causal effect). Distinguished from a dashboard, a predictive model, and a prescriptive system by the first two properties.
Observational Distribution. The probability distribution over outcomes observable in historical data, without intervention. Denoted P(Y | X). All standard dashboards, regression models, and machine learning systems trained on historical data operate on the observational distribution. The J.C. Penney pricing decision was made from the observational distribution.
Observability. The property of a measurement or analytical system that makes its own integrity visible as a first-class output — not just what is happening to the thing being measured, but what is happening to the measurement itself. An observable system detects failures in its own process and surfaces them before they reach decision-makers.
Pearl’s Ladder of Causation. A three-rung hierarchy of causal reasoning introduced by Judea Pearl. Rung one: association (seeing — what does the data show?). Rung two: intervention (doing — what would happen if we acted?). Rung three: counterfactual (imagining — what would have happened if things had been different?). Each rung requires qualitatively more powerful analytical machinery than the one below it. No rung is reachable by accumulating more data at the rung below.
Silent Failure. A failure mode in which an analytical system produces outputs that are indistinguishable from accurate reporting while measuring something systematically different from what users believe it is measuring. Defined by the absence of any error signal at the surface level. Both the WAU dashboard failure and J.C. Penney’s pricing inference are instances of the same underlying mode.
Structural Causal Model (SCM). A mathematical object that encodes the mechanisms of a causal system as a set of structural equations, each expressing how one variable is determined by its direct causes plus an independent error term. SCMs are the formal foundation of counterfactual reasoning. They encode not just the correlational structure of a system but the mechanism — the how and why — that would produce a specific outcome under any hypothetical intervention.